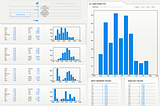
InCodeXbyMochamad Kautzar IchramsyahAutomate the exploratory data analysis (EDA) to understand the data faster and easierWhat is EDA?Jul 11, 202325Jul 11, 202325
InCoders MojobyNaina ChaturvediProject — Day 16 of 30 days of Data Analytics with Projects SeriesWelcome back peeps. This is Day 16 of 30 days of data analytics.Nov 24, 2022Nov 24, 2022
Moez AliBuild machine learning pipeline in Python and package it as a Docker ContainerLearn how to train and develop a machine learning pipeline in Python using PyCaret and then package it using docker container.Sep 21, 20221Sep 21, 20221
InVariablz AcademybyArunkumar NHow did I convert the 33 GB Dataset into a 3 GB file Using Pandas?Optimizing the dataset memory is the first and critical step in any data science project. A dataset may contain thousand to millions of…Sep 17, 20226Sep 17, 20226
Furkan KızılayEnd-to-end machine learning project using FastAPI, Streamlit and DockerIn this article, we will develop an end-to-end machine learning project with 11 steps in our own locale. After that, we will create an APIAug 11, 202213Aug 11, 202213
InPipeline: Your Data Engineering ResourcebyZach Quinn3 Data Science Projects That Got Me 12 Interviews. And 1 That Got Me in Trouble.3 work samples that got my foot in the door, and 1 that almost got me tossed out.Aug 29, 202291Aug 29, 202291
InTDS ArchivebyMadison HunterThe Top 20 Percent of Tools and Activities You Use as a Data Scientist Produce 80 Percent of the…The 80:20 rule tells us that these tools and activities give you the highest ROI as a data scientist.Aug 6, 20222Aug 6, 20222
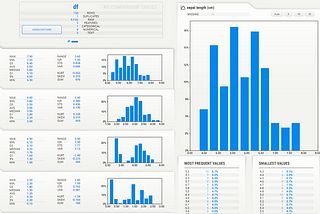
InTDS ArchivebyRebecca Vickery3 Tools for Fast Data ProfilingQuickly analyse and summarise your data with these Python toolsSep 19, 20224Sep 19, 20224
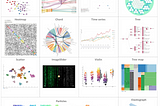
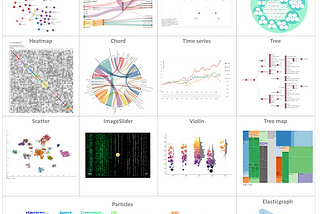
InTDS ArchivebyErdogan TaskesenD3Blocks: The Python Library to Create Interactive and Standalone D3js Charts.Create interactive, and stand-alone charts that are built on the graphics of d3 javascript (d3js) but configurable with Python.Sep 22, 202212Sep 22, 202212
InTDS ArchivebyAlvaro Leandro Cavalcante CarneiroAuto-Labeling Tool for Object DetectionStop wasting all of your time labeling datasetsSep 20, 20224Sep 20, 20224
InTDS ArchivebyGustavo R SantosStatistics for Data Science: Insights that you don’t want to missA compilation of learnings about statistics for Data Science, selected from courses that I took.Aug 28, 20221Aug 28, 20221
InTDS ArchivebyMadison Hunter5 Passive Income-Generating Products You Can Develop in Your Spare Time as a Data AnalystFinding your niche in these products will help you generate extra income on the side.Sep 15, 20224Sep 15, 20224
Leihua Ye, PhDWhy Data Scientists Should Learn Causal InferenceClimb up the ladder of causationJul 5, 20229Jul 5, 20229
InLearning SQLbyJosh BerryThe 5 Hardest Things to Do in SQLWith realistic examplesAug 25, 202215Aug 25, 202215
InTDS ArchivebyTDS EditorsData Visualization: Going Beyond ChartsOur weekly selection of must-read Editors’ Picks and original featuresAug 18, 2022Aug 18, 2022
InTDS ArchivebyTerence Shin, MSc, MBAFive Advanced Data Visualizations All Data Scientists Should KnowExpand your arsenal of data skills and tools with these visualizationsJul 5, 20223Jul 5, 20223
InTDS ArchivebyTariq MunirCOVID-19 data visualisation with PlotlyA beginner’s approach to Plotly using COVID-19 data. A stay-at-home long weekend project.Apr 13, 2020Apr 13, 2020
RitikajaiswalMy resume which landed me Data Analyst Job in 6 monthsTips along with real snapshots of my resume!Jun 18, 202232Jun 18, 202232
InTDS ArchivebyCostas AndreouLearn How to Create Animated Graphs in PythonThe basics of animated data visualisationMay 5, 20203May 5, 20203